

Most AI infrastructure cost comparisons answer the wrong question. They compare token pricing with self-hosting at a single point in time. Real teams don’t choose between two static numbers, they decide when to switch, and what happens if they get that timing wrong.
So we built a 12-month model instead of a snapshot, and the answer turned out to be more interesting than “switch at the right time.” The real finding is that the two ways of getting the timing wrong aren’t equally costly. Switching too early is a minor, forgivable mistake. Switching too late compounds every month you wait. That asymmetry, not the existence of a break-even point, is the useful thing to take away here.
The Setup
As with our previous cost modeling, this is an illustrative example with every assumption stated, not a real customer’s invoice. The per-query pricing basis matches our earlier piece on token pricing risk, so the two are directly comparable.
- A workload starting at 20,000 queries/month, growing to 1,000,000 over a year on a realistic pilot-to-production curve
- 4,000 input tokens and 300 output tokens per query, the “optimized” profile from our earlier piece
- API pricing at production-tier rates: $3/million input tokens, $15/million output tokens (Claude Sonnet-class, real published mid-2026 rates)
- Owned infrastructure: $2,500/month for reserved GPU capacity, plus a one-time $20,000 setup and migration cost
What this model deliberately includes and excludes: the $2,500/month figure covers GPU infrastructure only. It excludes ongoing engineering support, monitoring, on-call, model upgrades, GPU utilization inefficiency, and compliance overhead, because those vary too widely between organizations to model honestly with one number. Including a realistic ops overhead shifts the break-even point meaningfully higher, not just at the margins. We show that shift explicitly later in this piece rather than pretending it away.
This is intentionally a single-workload model. Most organizations run many AI workloads with different growth curves and different pricing tiers. The specific numbers here won’t transfer directly to your situation. What should transfer is the shape of the finding: that the cost of missing your own break-even point isn’t symmetric.
The Break-Even Point, and Why It’s Not the Interesting Part
Under these assumptions, the point where owned infrastructure’s fixed cost becomes cheaper than the API’s variable cost is:
Break-even query volume = owned infrastructure fixed cost ÷ cost per query
= $2,500 ÷ $0.0165
≈ 151,500 queries/month
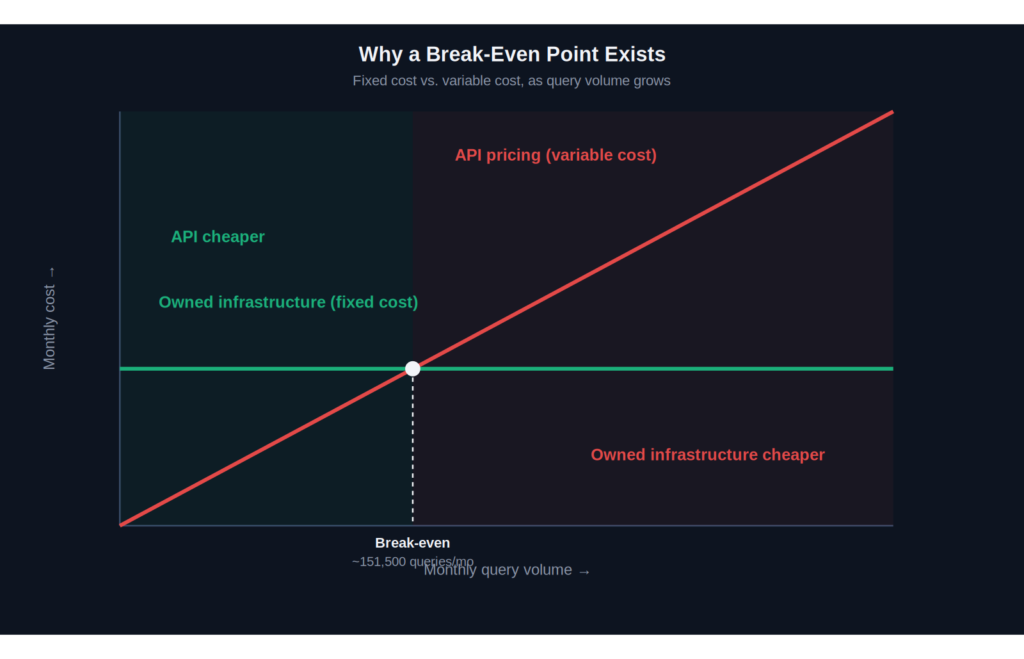
Why a break-even point exists: fixed cost vs. variable cost as query volume grows.
Calculating the crossover point is straightforward arithmetic. The more interesting question is what happens when you don’t switch exactly there, which, in practice, almost nobody does.
What Missing the Timing Actually Costs
We modeled switching at several different points relative to the calculated optimum (month 5 in this growth curve), instead of assuming anyone hits it exactly.
| When you switch | 12-month total | Cost of the miss |
| 2 months early (month 3) | $45,990 | +$1,205 |
| 1 month early (month 4) | $44,810 | +$25 |
| Exactly on time (month 5) | $44,785 | $0 |
| 1 month late (month 6) | $46,905 | +$2,120 |
| 2 months late (month 7) | $51,830 | +$7,045 |
| 4 months late (month 9) | $69,435 | +$24,650 |
| Never switch | $101,145 | +$56,360 |
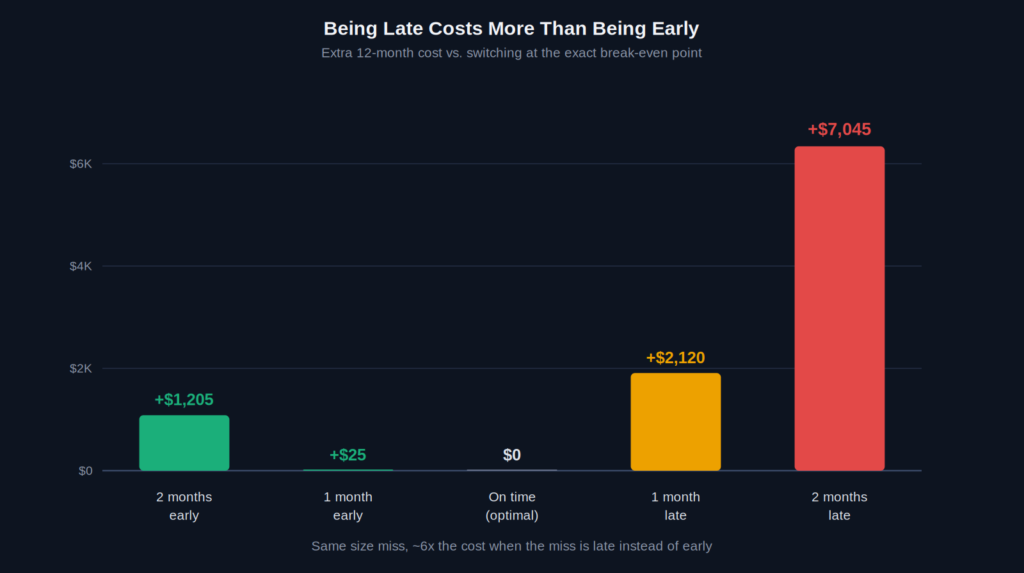
Cost of missing the optimal switch timing by different amounts.
The asymmetry is the finding. Switching two months early costs $1,205, a rounding error against a $45,000 annual figure. Switching two months late costs $7,045, nearly six times as much for the same two-month miss.
The reason is structural, not incidental. Switching early incurs a mostly fixed penalty: you start paying infrastructure costs before they’re fully justified by volume, but that penalty doesn’t grow, it’s the same fixed cost whether you’re one month or three months premature. Switching late compounds, because the workload keeps growing while you’re still paying the API’s variable, per-query cost. Every additional month of delay applies to a larger volume than the month before, so the cost of lateness accelerates while the cost of earliness stays flat.
Under this model, a modestly premature migration is substantially less costly than an equally delayed one. Organizations expecting sustained growth may therefore prefer to bias toward slightly earlier planning rather than waiting for perfect certainty, though that’s a directional preference, not a universal rule.
That preference has real limits, though. If migration itself takes months, if the engineering team is already stretched, if actual GPU utilization would run low, or if capacity gets reserved on a long-term contract, the early side of this tradeoff gets more expensive too, and the calculation should reflect that rather than defaulting to “always move early.”
What surprised us: the biggest surprise wasn’t the break-even point, it was how forgiving early migration turned out to be. In this model, being two months early costs about $1,200, while being two months late costs more than $7,000, for what’s structurally the same size of timing miss.
Rule of thumb: if your workload is growing steadily, the cost of waiting tends to increase faster than the cost of moving slightly early. Delayed migration keeps applying variable API pricing to an expanding workload; premature migration mainly just incurs fixed infrastructure costs a little sooner than necessary.
The full picture across all three strategies, staying on API pricing all year ($101,145), deploying owned infrastructure from day one ($50,000), and switching at the calculated optimum ($44,785):
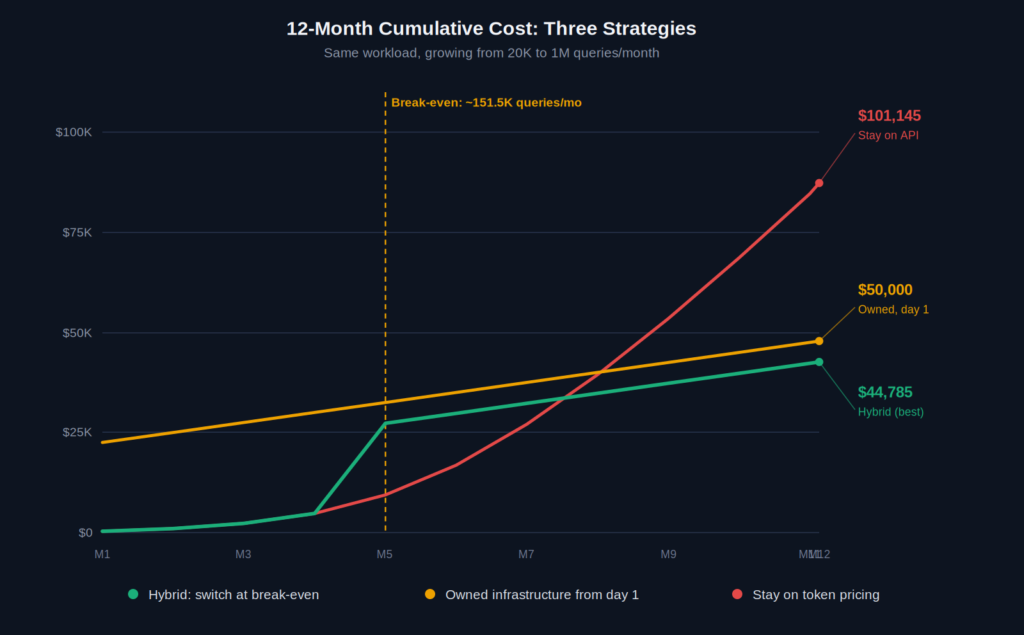
Twelve-month cumulative cost comparison across three strategies.
The Transition Threshold Shifts With Your Actual Assumptions
The 151,500 figure above is specific to one pricing tier and one context size. Here’s how that crossover point moves under other realistic assumptions, using the same GPU-only $2,500/month fixed cost:
| Scenario | Cost/query | Break-even volume |
| Budget-tier model (~$0.80/M in, $4/M out) | $0.0044 | ~568,000 queries/mo |
| Production-tier, optimized context (this model) | $0.0165 | ~151,500 queries/mo |
| Production-tier, unoptimized context (8K tokens) | $0.0315 | ~79,000 queries/mo |
| Flagship-tier model, optimized context | $0.0550 | ~45,500 queries/mo |
A team on a cheaper model with a small context window might not hit break-even until nearly 600,000 queries a month. A team on a flagship model with a bloated, unoptimized context could hit it well under 50,000. The model, not the number, is what’s transferable.
One more honest adjustment: as one illustrative example, if you add a conservative $1,500/month for the ongoing engineering and operations overhead this model deliberately excluded, fixed cost becomes $4,000/month and the break-even point moves to roughly 242,000 queries/month, about 60% higher than the GPU-only figure. The specific $1,500 is an illustrative planning assumption, not a benchmark, your own number will depend on team size and existing tooling, but the direction of the shift (meaningfully higher, not marginal) is the durable point.
It’s Not Only About Cost
Everything above is a financial model, and financial models aren’t the only reason organizations move to owned infrastructure. Latency requirements, data residency and sovereignty obligations, vendor lock-in risk, model flexibility, and compliance posture all factor into this decision independently of cost, sometimes overriding it entirely. A regulated workload might justify owned infrastructure well before the cost math favors it. A genuinely low-stakes internal tool might stay on API pricing indefinitely even past its break-even point, because the migration effort isn’t worth it for that workload’s importance. Cost is one input, not the whole decision.
Implications
The evidence here supports a narrower claim than “self-host your AI.” It supports this: many AI workloads running at sustained, predictable volume eventually reach an economic crossover where fixed infrastructure becomes cheaper than metered pricing, that point is calculable from your own usage and pricing data, and missing it late is meaningfully more expensive than missing it early. This doesn’t hold for every workload, extremely bursty or sporadic traffic, workloads tied to whichever frontier model just shipped, or teams too small to operate infrastructure may never cross that threshold in a way that’s worth acting on, and that’s a legitimate reason to stay on metered pricing indefinitely, not a gap in the analysis. For the workloads where it does apply, none of this requires knowing your future growth curve precisely, it just requires checking where you actually stand against your own break-even point periodically, rather than deciding once and not revisiting it.
This analysis is most relevant for teams with AI workloads that are growing steadily toward production scale. If your usage is highly bursty or still experimental, metered APIs may remain the better operational choice regardless of where the cost crossover happens to sit.
One practical challenge this analysis doesn’t fully capture: organizations rarely move from API-based inference to private infrastructure in a single step. Many run both for months while a workload matures, exactly the mixed operating model this piece has been arguing for. That’s the operating model XePlatform is designed around: managed AI endpoints and private GPU infrastructure running together inside your own cloud account, allowing routing decisions to evolve with workload economics instead of requiring a single, high-stakes migration.
If you’re unsure where your own workloads sit relative to their break-even point, the useful exercise isn’t copying the numbers in this article, it’s calculating your own, using your actual usage, pricing, and infrastructure costs. We’re happy to help you work through that analysis.
The purpose of this model isn’t to predict your exact savings. It’s to demonstrate that the penalty for missing your break-even point is asymmetric, not that the point itself is universal. The exact numbers depend on your workload, your pricing tier, and operational costs this model doesn’t include.
Sources
- Anthropic Claude Platform pricing (platform.claude.com/docs/en/about-claude/pricing): production and flagship-tier per-token rates
- Internal cost model, consistent with the per-query cost basis used in “Why Token-Based AI Pricing Is a Ticking Time Bomb for Enterprise Budgets”
Suggested standalone CTA block for the page (not part of the article body):
Try the AI Infrastructure Break-Even Calculator — Don’t use our numbers, use yours. Enter your own workload, pricing, and infrastructure costs to find your own crossover point in seconds. [Calculate Your Break-Even →]